Page 2

Astronomical Transparency and Seeing
By Don Carona
There are hundreds of articles that cover astronomical seeing and transparency. My goal here is to discuss the most basic science underlying each of these concepts. I will preface that what I write is more of a discussion of a collection of notes rattling around in my head that I've either accrued through reading or practice. Some basic knowledge of seeing and transparency can help each of us understand the observing parameters on a given night. Whether you've looked at the night sky through binoculars or a telescope or your unaided eyes, you've probably noticed the effects of transparency and seeing even if you didn't realize it.
Astronomical transparency and seeing are rather straight-forward concepts, but before we dive into that discussion, let's settle on a quick understanding of the atmosphere pertinent to the discussion. From the ground to the edge of space, Earth's atmosphere is broken into 5 primary layers: troposphere, stratosphere, mesosphere, thermosphere and exosphere. In astronomy, we are mostly concerned with the troposphere because that's where more than 75% of the mass of the atmosphere exists and almost all (>99%) of the water vapor exists. The troposphere extends from the ground upward to between 7 km and 20 km in altitude.
Transparency
Transparency is how clear the atmosphere is between you (ground level) and an object outside our atmosphere, such as a star. For instance, let's say you went outside last night and were able to see stars down to 6th magnitude. The night before you could only see stars to 4th magnitude. On both nights, the skies were cloud-free. You can state with confidence that the transparency last night was much better than it was the night before because you could see fainter stars.
Transparency is determined by the amount of water vapor in the atmosphere above you and is different for every location on Earth at any given time. The higher the level of water vapor, the worse the transparency. Transparency also increases with a decrease in air mass such that observing near the zenith (air mass = 1) will be more transparent than observing an object near the horizon where the air mass will be significantly higher. Air mass is the distance that light has to travel through the atmosphere. When you observe near the zenith, you're looking through a single column of atmosphere. As a result, the light from a star is less susceptible to scattering and absorption. The closer to the horizon you observe, the worse the transparency.
Geostationary Operational Environmental Satellite
Depending on your observing goal during a particular night, you might want to know the water vapor levels before you go outside. For this information, we can rely on the Geostationary Operational Environmental Satellite (GOES) constellation operated by the National Oceanic and Atmospheric Administration (NOAA). Specifically, the GOES-13 and the new GOES-16 satellites offer us a complete picture of the levels of water vapor over the contiguous United States (CONUS).
For the GOES-13 satellite, we're interested in spectral band #3 (6.48 μm), which measures upper level water vapor. The new GOES-16 satellite, which is still officially in testing mode, offers 3 bands that cover the full water vapor picture: #8 Upper-Level (6.2 μm), #9 Mid-Level (6.9 μm) and #10 Lower-Level (7.3 μm). I typically look at the GOES-13 (GOES EAST) satellite imagery. Consider the satellite image to the right taken from the GOES-13. Shades of gray represent varying intensities of upper-level water vapor. White represents very high levels of water vapor and black represents very low levels of water vapor. The less water vapor over your area (black) the better the transparency.
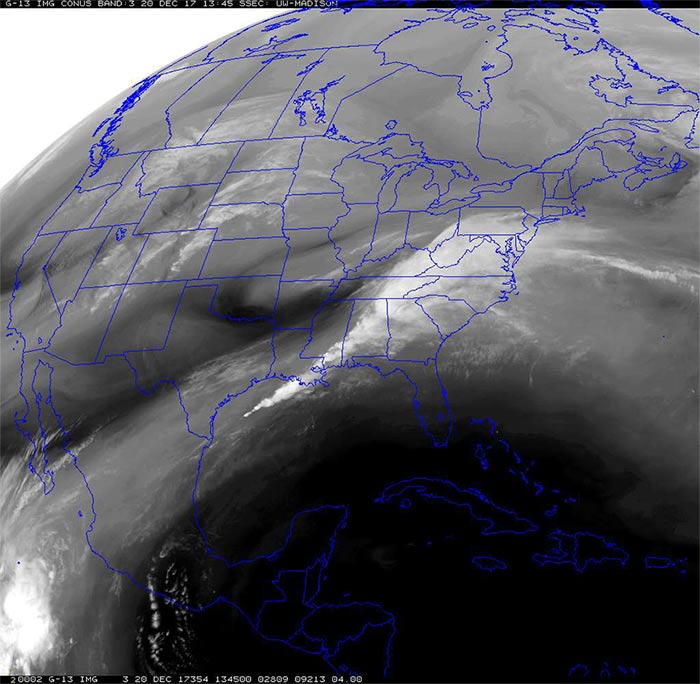
The black area on the satellite map indicates an area of low water vapor.
Levels in the Troposphere
When NOAA refers to "upper," "mid," and "lower" level water vapor, they are referring to levels in the troposphere. The troposphere is a rather narrow region of the atmosphere; so, analysis of any of the bands will generally be good enough to give you an idea of how good the transparency will be when you start observing. The distance from the ground to the upper altitude of the troposphere is greatest at the equator and decreases moving toward Earth's poles. Regardless, no observing site in the world is free from instances of bad transparency. Since water vapor exists throughout the troposphere, we would have to climb to an altitude that's higher than the upper boundary into what is known as the tropopause, which is several times higher than the highest peak on Earth.
Transparency degrades rapidly when the atmosphere approaches dew point, which is when the air becomes saturated with water vapor. This is a real problem in our region of Texas because the dew point is tied to the humidity level. That means reaching dew point on any given night is almost a certainty. If you're like me, you just keep your fingers crossed and hope the atmosphere doesn't reach that point until after your observing has been completed. Of course, there's always the hair dryer in the observing kit that allows me to forge ahead.
Seeing
Seeing refers to the distortion of an object i.e.(blurring, twinkling) along a line-of sight. Continuing our previous example, let's say that the stars were twinkling rapidly last night whereas the night before they were very steady. Therefore, the seeing was much better the night before than it was last night.
We've actually learned something very important from our example: transparency and seeing are independent of one another. That's because seeing isn't determined by water vapor. Seeing is determined by what is known as atmospheric turbulent mixing. Turbulent mixing gets deep into fluid dynamics, but the crux of it comes down to how much the atmosphere perturbs the object you are observing. The primary driving forces of these perturbations are wind, air density and temperature. Most of the mixing occurs where the ground meets the troposphere (planetary boundary layer). A thin layer of friction exists at the ground and extends to a maximum of about 2 km above the ground.
Scintillation Example
These variations can be compared to looking down an asphalt road on a hot summer day where you would notice the shimmering effect (scintillation). The temperature of the road is higher than the air above it. The road heats the air causing the air to become less dense (decrease in atmospheric pressure). The lower density causes the air to rise. As it rises, the air cools at different rates creating pockets of variations in air density and temperature. These variations change the direction of the light that reaches our eyes, which in turn creates the shimmering effect . . . variations in luminance.
If you sit directly in front of a fan, you'll feel a smooth, steady flow of air. Place an object between you and the fan and the air flow is interrupted causing the air to move around the object along different paths. The air directly behind the object will move much slower than the air to the side and eddies will form. At the planetary boundary layer, air/wind is deflected by any number of obstacles such as trees, mountains, buildings, etc. and deliver us our turbulent mixing at the ground layer. This mixing causes the light from objects outside our atmosphere to vary in luminance.
Poor Seeing
What does all this mean for our observing programs? If you're observing visually, poor seeing can prevent you from observing detail in faint structures since the finer details tend to blur together or jump around in the eyepiece. Poor seeing can also make it nearly impossible to separate close binary stars in the eyepiece as the skewing of light blends the pair together. Solar system objects such as the Moon, Jupiter and Saturn are less susceptible to scintillation, but not immune. When viewed through a telescope, the distortions can make it difficult to see fine detail.
Imaging programs can be greatly hampered by poor seeing. If you had a telescope in space with no atmosphere to worry about, images of stars through your telescope at the best possible focus would have an apparent size that is limited only by diffraction. The stars would appear very well defined and amazing. Just look at any of the images taken by the Hubble Space Telescope after it was repaired. Under an atmosphere, the apparent size of the stars in our images increase significantly depending on the seeing conditions. Another way to think of it is that each star in the image from space would cover fewer pixels on the detector than the same field from the ground.
Quantitative Measure of the Seeing
As observers, we are interested in knowing the quantitative measure of the seeing. That measurement is the full width at half maximum (FWHM) averaged over several stars within an image. The FWHM is a plot of the intensity (flux) of the pixels across the entire region of a star on an image, which creates a curve that represents the diameter of the seeing disk at half its peak intensity.
Best Angular Resolution
According to the plot to the right, the star I measured had a peak intensity of ~32000 counts (pixel value). Half of that value is ~16000. The radius of the star at that value is ~1.2. Since 1.2 is the radius, we multiply by 2 to get the diameter and that yields a FWHM value of ~2.4 arc-seconds ("). The three values in the lower right of the plot are the FWHM results from IRAF based on three different algorithms. The value at the far right is a direct measurement and the one that I use most often. Now, what exactly does all this mean?
Simply put, it refers to the best angular resolution that can be achieved in an image at the moment the image was obtained. The bigger the FWHM, the worse the seeing and that can mean ugly images or data depending on your observing program. To add some context, Pluto's moon Charon has an apparent magnitude of 16.8. That magnitude is easily reachable with a modest CCD camera through small optics. However, the angular separation between Pluto and Charon from our vantage point on Earth is about 0.9". If the seeing at our observing site is greater than the angular separation between Pluto and Charon, it would be impossible to distinguish the two as separate objects as they would blend together.
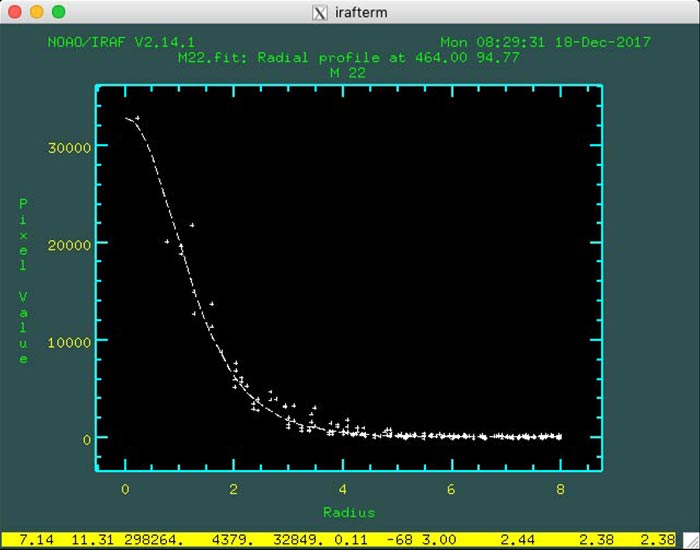
The plot above is one I made using IRAF
based on the image of M22 I took in mid-July.
The seeing of 2.38" during the imaging of M22 was reasonable for our location. Generally, the seeing from the Observatory over a year averages 3" and is best during mid to late summer where seeing can be as good 2" albeit briefly. Ideally, we would prefer the seeing to be at 1" or less, but that is a pipe dream from just about anywhere in Texas. The best way to get into better seeing is to gain elevation. Higher elevation equates to a more uniform (smooth), uninterrupted wind with less temperature fluctuation due to convective heating. We also move further away from boundary layer turbulence as we gain elevation. If you're feeling down that you don't sub arc-second seeing at your observing site, you can take solace in the fact that every observing site, no matter its location, has bouts of bad seeing. The best-of-the-best observing site are high elevation, island based. I bet you can figure out why now.
A Few Loose Ends
These are simply the basic principles behind astronomical transparency and seeing. There are other factors that can change the transparency and the seeing beyond what has been mentioned here. For example, smoke from wildfires, particles from volcanic activity, dust from drought and pollution all contribute to a lesser extent. Of course, there are the extreme situations like the Mount St. Helens eruption that created atmospheric issues all over the U.S.
If there are no clouds and/or precipitation in the sky, do I care if the transparency or seeing are poor? No. If I'm interested in observing, I'm going to observe unless weather conditions warrant keeping the dome closed or prevent me from setting up in my backyard. I might not try to find a 21st magnitude minor planet if the seeing is much greater than 3" or if the transparency is really bad. Instead, I find a brighter target to observe that won't be a waste of time.
Image Reduction and Analysis Facility (IRAF) previously mentioned, is a free software package for UNIX, Linux and MacOS based computing systems that offers a wealth of tasks for analyzing astronomical FITS images and is developed by the National optical Astronomy Observatory (NOAO).
While it is possible to run IRAF through a Windows operating system via Cygwin, you must be very brave and have a wealth of patience and a lot of hair you don't mind losing. It's better to invest in software that will allow you to run a virtual operating system and install any one of the free Linux distributions to run IRAF.
Flexible Image Transport System (FITS) is a digital file format that is designed for science data and supports raw, astronomical image data. What separates the FITS standard from other image types is that it employs an extensible header that defines the data as well as the parameters used to gather the data.
Satellite imagery, forecasts, astronomy forecasts and station data can be viewed from the Observatory weather page Observatory weather page. One note about weather forecasting sites that offer seeing forecasts. Seeing forecasts will often describe the seeing in arc-seconds; however, it's not an actual measurement of the "seeing" as described here, but more of a scale of "how good". When a web site offers the seeing in arc-seconds, you have to read their information to understand how they are using that measurement.
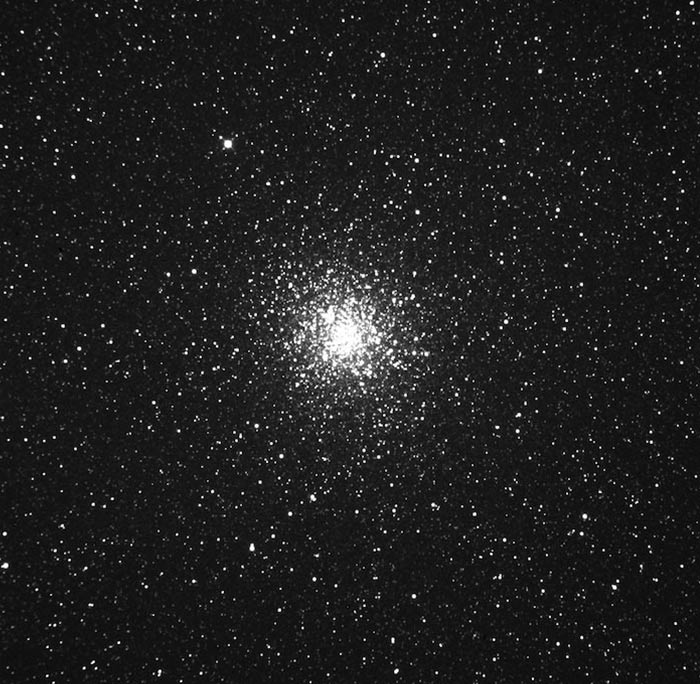
Image of M22 below taken with the 0.5 Meter OGS + SBIG STX-16803, 30 sec. exp.
